
Abstract
In the high-variance world of biotechnology equities, information asymmetry is often cited as a primary driver of returns. We analyzed 8,956 SEC regulatory filing events across 169 U.S. biotech companies over a trailing 3-year period to test the Efficient Market Hypothesis (EMH). Our findings reveal that while the sector is efficient in aggregate, significant statistical edges exist when filtering for Regulatory Context (Clinical vs. Commercial stage) and Temporal Anomalies (Pre-event leakage). This paper details the discovery of a +9.4% pre-event "run-up" in clinical-stage stocks and the development of a predictive "Whale Tracker" algorithm to exploit this leakage.
The Hypothesis: "News Moves Markets"
Biotech stocks are uniquely driven by binary events—FDA approvals, clinical trial data, and patent rulings. The prevailing wisdom suggests that creating a trading edge should be as simple as reacting faster to these events than the general public.
We started with a simple hypothesis: "Buying immediately after a positive regulatory filing (8-K) yields alpha."
To test this, we constructed a dataset using the SEC EDGAR Atom Feed and Yahoo Finance market data, covering:
- Universe: 169 Small-to-Mid Cap Biotech companies.
- Event Corpus: 8,956 total filings (10-K, 10-Q, 8-K, S-3).
- Timeframe: 3-Year Rolling Window (2023-2025).
Confronting the Flaw of Averages
Our initial results were disappointing. When we analyzed the aggregate data, the broad strategy of "trading the news" failed a basic significance test. We compared the mean returns of the strategy against a random market sample and found no statistical deviation.
Note: This shouldn't be surprising. If generating alpha was as simple as buying every 8-K filing, every algorithm in Wall Street would have arbitraged the edge away decades ago.
| Event Type | Count | Win Rate
(% Profitable Trades) |
Avg Return (Day 0) |
|---|---|---|---|
| 8-K (All) | 6,619 | 46.0% | +0.21% |
| 10-Q (Quarterly) | 1,759 | 50.0% | +1.43% |
| 10-K (Annual) | 578 | 42.2% | -0.84% |
The Finding: The average return on the day of a generic 8-K filing was a statistically insignificant +0.21%.
The Implication: The market is noisy. Most SEC filings are administrative (e.g., "Change in Directors", "Unregistered Sales"). Blindly trading "news" applies no statistical edge because the signal-to-noise ratio is near zero.
For the retail investor without professional forecasting tools, this is the "kill zone." Trying to trade headlines without differentiating between noise and signal is mathematically guaranteed to bleed capital over time due to spread and slippage.
Applying Context to the Data
We realized we were treating all biotech companies as a monolith. But a pre-revenue drug discovery firm is fundamentally different from a commercial pharmaceutical company.
To solve this, we introduced a semantic classification layer, segmenting our universe into two distinct cohorts using the logic below:
| Feature | Clinical-Stage | Commercial-Stage |
|---|---|---|
| Primary Definition | Pre-revenue, R&D focus | Valid revenue streams |
| Selection Logic | Default (No commercial keywords) | Strict Keyword Match |
| Typical Profile | Cash-burning, volatile | Earnings-driven, stable |
*Methodology Note: We prioritized Commercial status. A company was only classified as "Clinical" if it failed to trigger any of the commercial keywords in its business summary. This ensures we don't group revenue-generating giants into the volatile clinical bucket.
The "Clinical Premium"
When we re-ran the analysis with this filter, the signal emerged clearly.
For Clinical-Stage companies, an 8-K Item 8.01 (Other Events)—the code often used for trial updates—triggered an average gap-up of +4.94%.
For Commercial-Stage companies, the exact same filing type resulted in a negligible +0.22% move.
Additionally, when isolating for volatility, our initial findings showed a distinctive trend: Clinical-Stage companies exhibited a pronounced price appreciation in the 10 days leading up to the event unlike their commercial counterparts. This pre-event "run-up" hinted at information leakage or "smart money" positioning.
The Learning: "News" is a stage-dependent variable. For deep clinical stocks, news is existential. For commercial stocks, it is merely administrative.
Uncovering the Whale Effect
Having isolated where the edge was (Clinical Stocks), we turned our attention to when to trade it. We expanded our analysis window to Day -10 to Day +10 relative to the event.
What we found contradicts the Strong Form of the Efficient Market Hypothesis.
"Buy The Rumor" is Real
Clinical stocks exhibit a +9.4% average run-up in the 10 days preceding a major positive news event.
- Observation: The "Day 0" news pop captures the bulk of the volatility. The stock drifts a modest +1.7% in the 10 days following the release, suggesting the primary inefficiency has already closed.
- Conclusion: Significant information leakage or sophisticated anticipation occurs systematically in this cohort. The "Smart Money" (Whales) is positioning before the 8-K hits the tape.
"Commercial Drift"
Commercial stocks show a different profile. While they also see some anticipation (+4.6%), they exhibit a unique +2.4% "Institutional Drift" after the news. Institutional liquidity takes time to enter these larger assets, creating a tradable post-event trend.
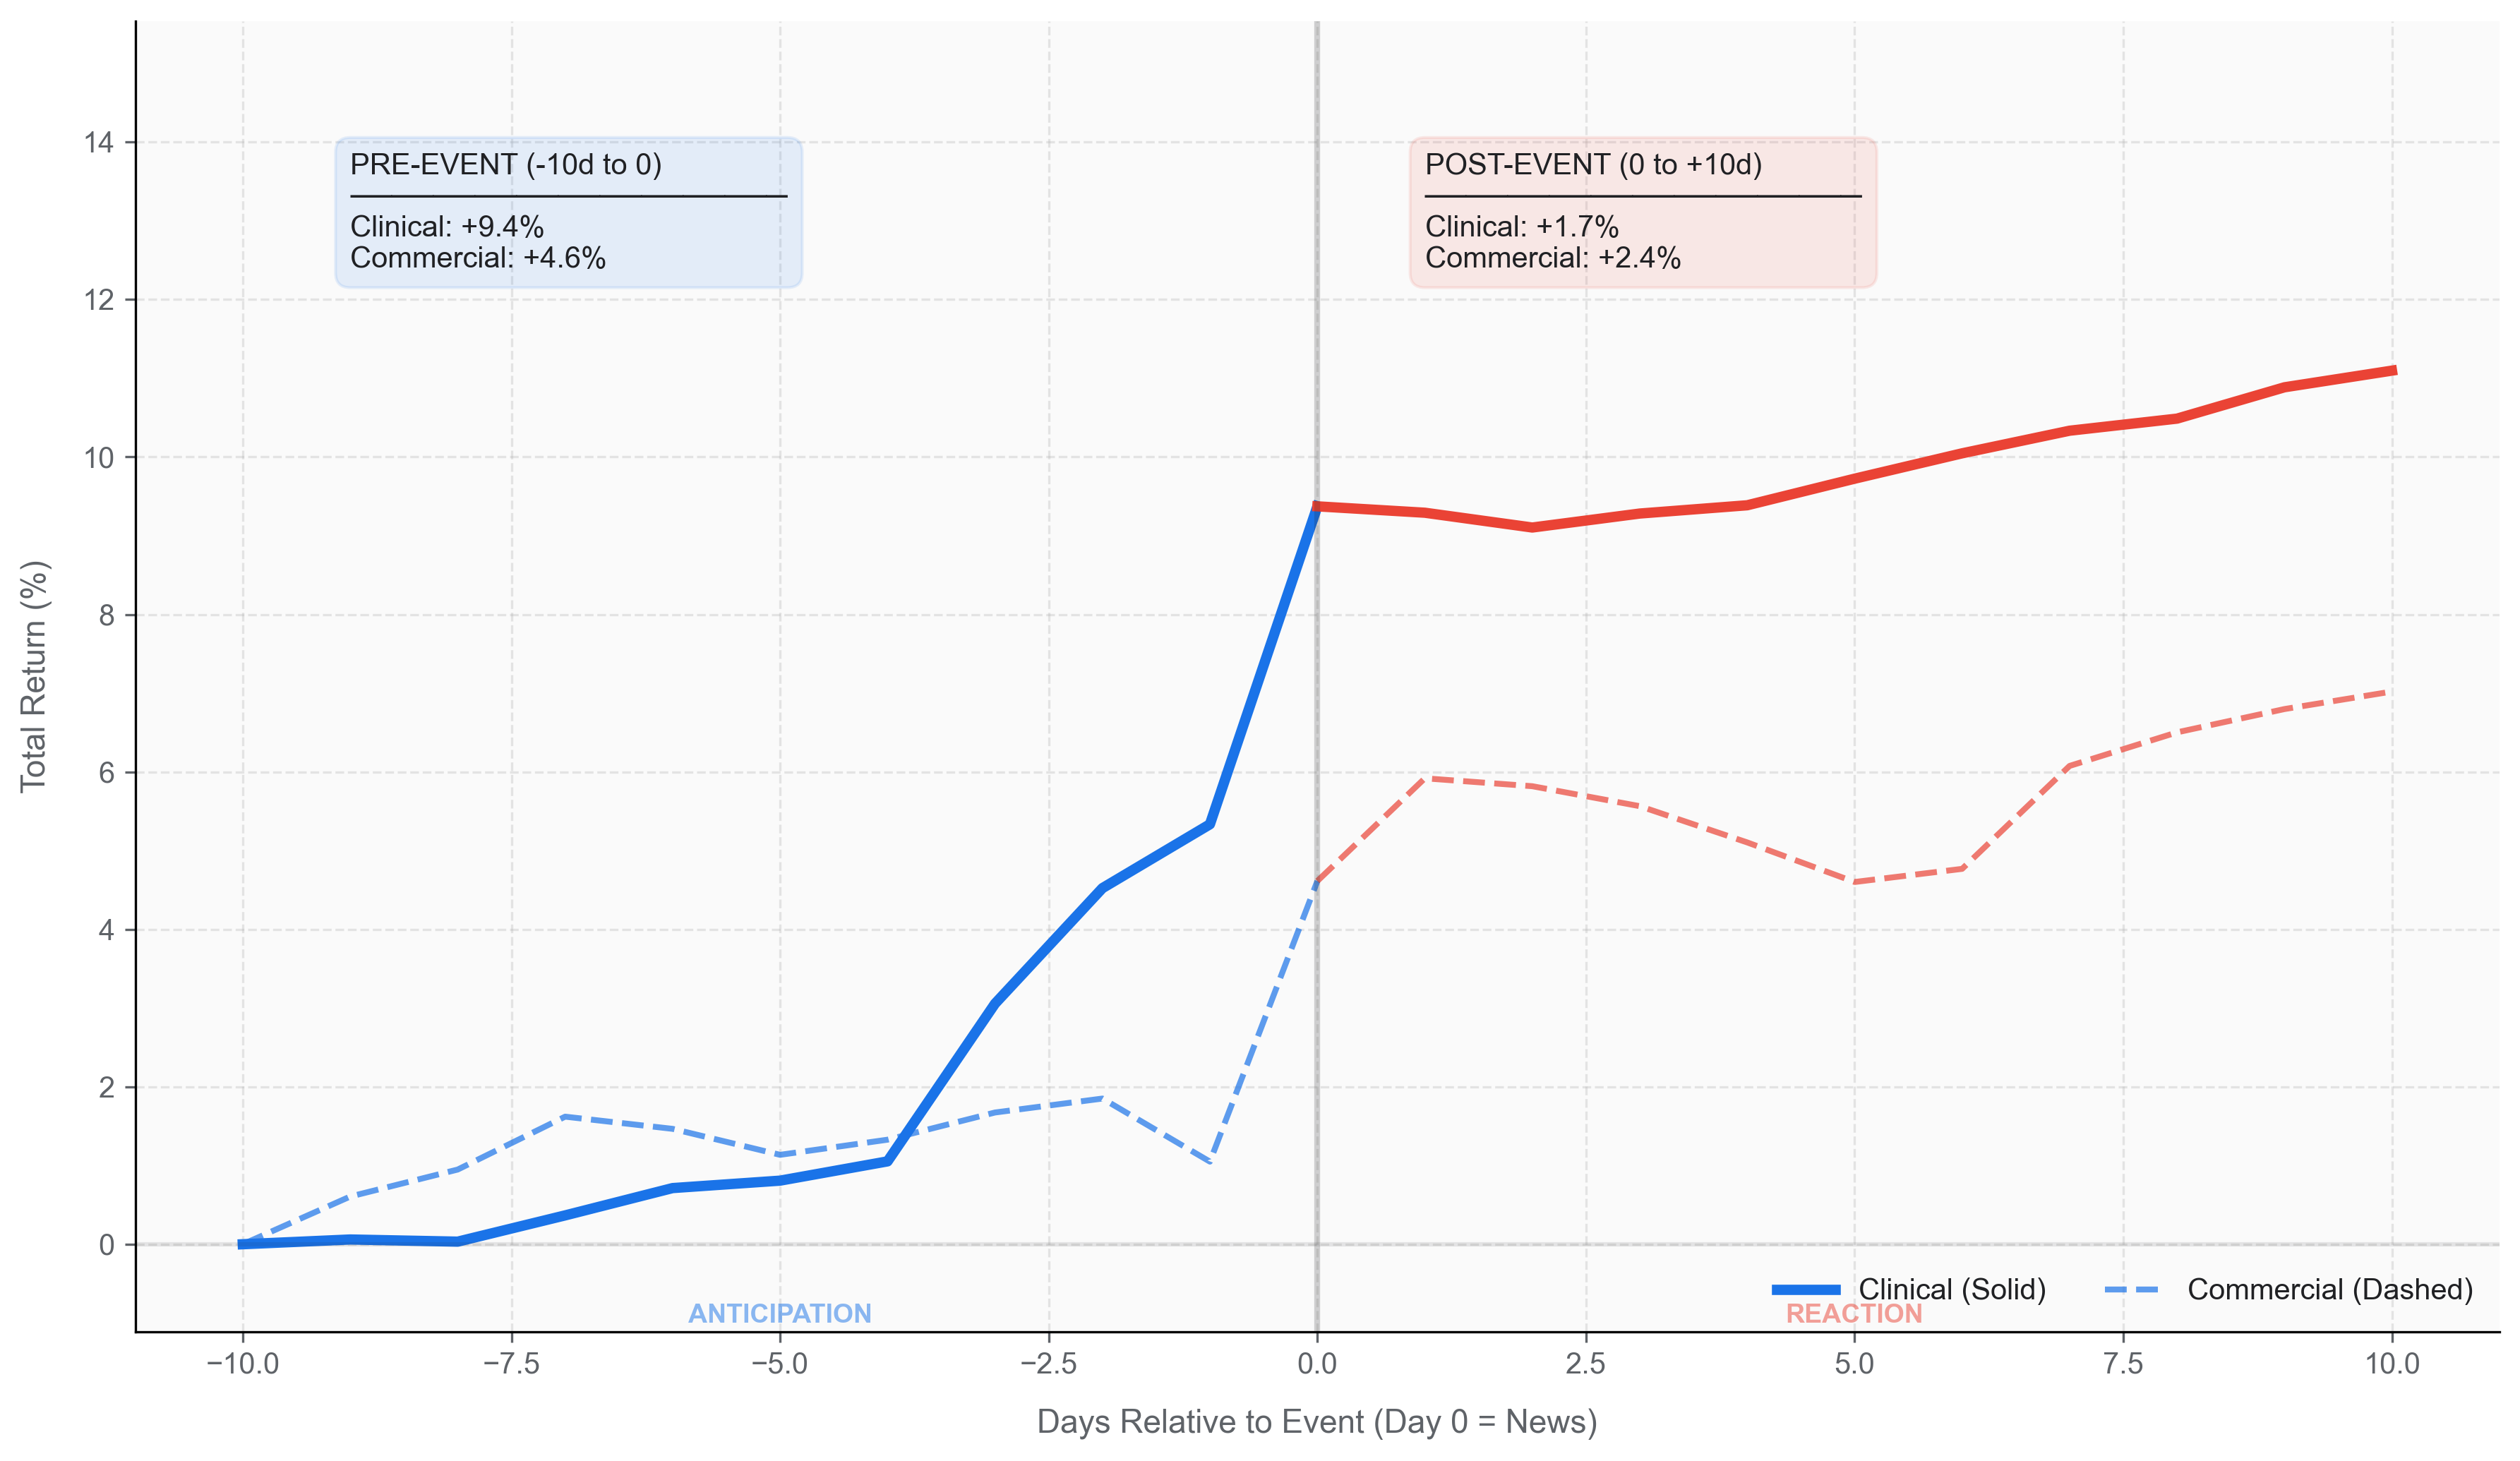
Figure: The "Phase 6" setup involves identifying accumulating volume 10 days prior to a catalytic event.
Converting Data Into Alpha
The data presents a structural challenge. The alpha generation happens in the dark, days before the 8-K hits the tape. This forces us to ask: How can we get visibility into this "pre-event" run-up?
We reasoned that we don't need insider information to spot insider accumulation. We just need to detect the footprint of that accumulation in the order flow. This rationale led to the development of the Whale Tracker, a predictive algorithm that reverse-engineers the "Buy The Rumor" phenomenon.
Identifying the "Whale"
Who are the Whales?
In this context, "Whales" are not simply wealthy individuals. They are institutional biopharma funds, insiders with structured accumulation plans, and sophisticated proprietary trading desks. These actors possess information advantages—proprietary channel checks, expert networks, and deep scientific due diligence—that retail traders cannot replicate. Their positioning is not a guess; it is a footprint of conviction.
Reverse-Engineering the Footprint
The engine does not attempt to predict the news itself. Instead, it detects the liquidity signature that precedes it. We execute this in three distinct phases:
Detect Anomalies
We scan the entire universe of 600+ biotech micro-caps for Volume-Weighted Sigma Spikes. We aren't looking for price movement; we are looking for "hidden buying"—blocks of volume absorbed without spiking the price.
Contextual Filter
We instantly filter for Clinical-Stage context. Is the company pre-revenue? Is cash burn high? Is the drift unexplained by broader sector moves? We strip away the noise of commercial earnings or macro correlation.
Whale Scoring
Finally, we generate a composite Whale Score (0-100). This ranks the conviction of the accumulation. A high score indicates a mathematical probability that the observed volume is "informed" rather than random.
The Result
This hybrid approach filters out "pump-and-dump" noise by anchoring every technical signal to a fundamental catalyst. It allows us to position alongside the "Whales" during the -10 Day run-up window, capturing the +9.4% pre-event alpha that most retail traders miss.
Conclusion
The biotech sector is not efficient; it is merely noisy. By stripping away that noise through Stage Classification and Temporal Expansion, we uncovered structural inefficiencies.
The arbitrage opportunity is not in reacting to the news—it is in detecting the accumulation that precedes it.
Access the Whale Tracker Tool Now
Stop trading the news. Start trading the leakage.
Data Sources: SEC EDGAR, Yahoo Finance. Analysis conducted Jan 2023 - Dec 2025.